RESOURCES / BLOG / GROWTH & ANALYTICS
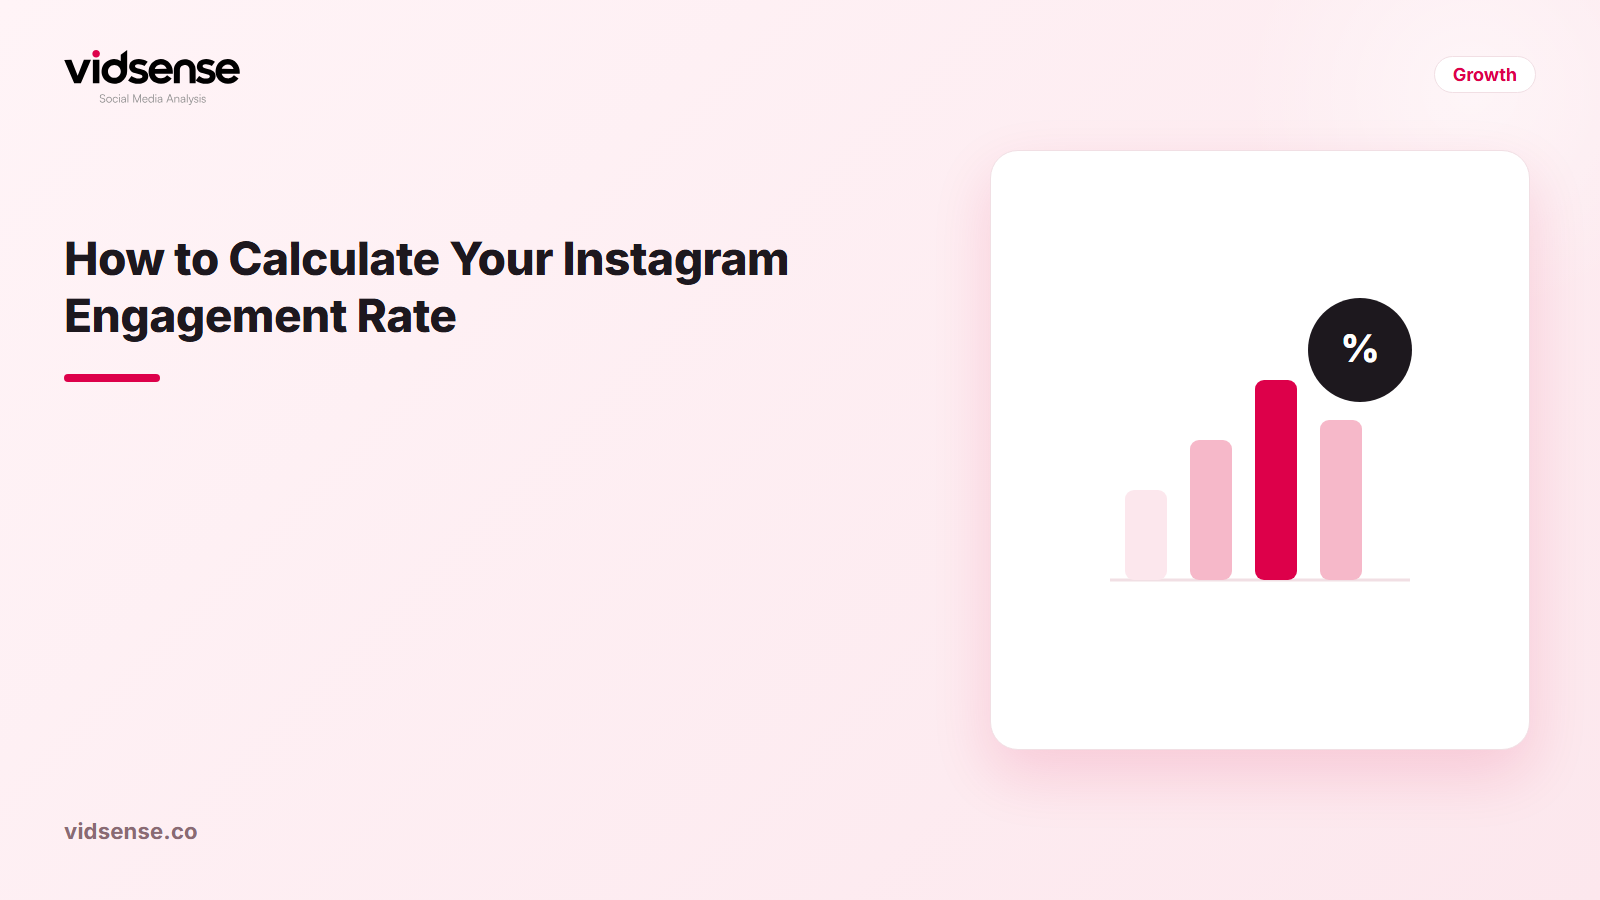
Engagement rate tells you how much the people who saw or follow your content actually interacted with it. It's the sum of likes, comments, saves, and shares, divided by either your follower count or your reach.
A raw like count says very little on its own. An account with 10,000 followers getting 200 likes can look "better" than an account with 1,000 followers getting 150 likes — until you compare the rates side by side.
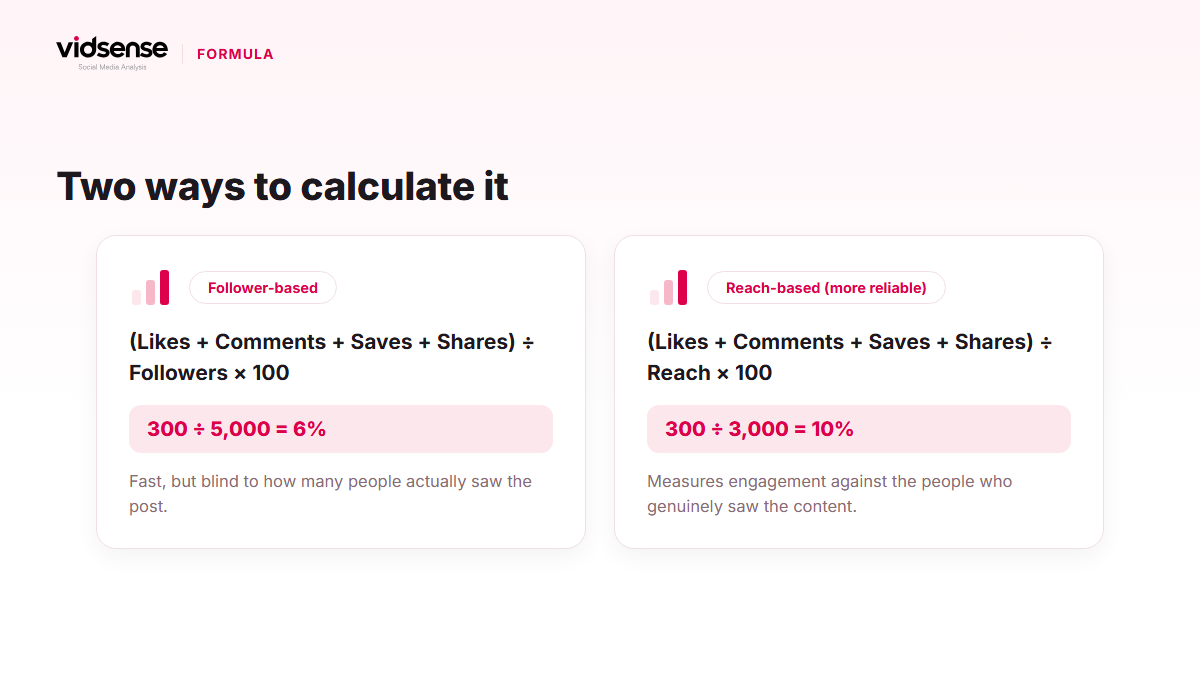
The simplest formula is (likes + comments + saves + shares) / followers x 100. It's fast, but it has a blind spot: follower count doesn't tell you how many people actually saw the post. A large account with a small active audience can look artificially weak in this formula.
Once your Instagram account is connected, reach data becomes visible. (likes + comments + saves + shares) / reach x 100 is more accurate because it measures engagement against the people who genuinely saw the content. Reach moves independently of follower count — a post can reach non-followers, or reach only a small fraction of your followers.
A high engagement rate is generally a sign that content resonated with the audience it reached. That much is useful.
But on its own it won't tell you why reach was low, where viewers dropped off, or whether there's a recommendation-eligibility issue at play. Those questions need reach and audience-response signals looked at separately — no single ratio replaces that.
Check your content before you post it.
Use Content Check to see potential risk signals before you publish.
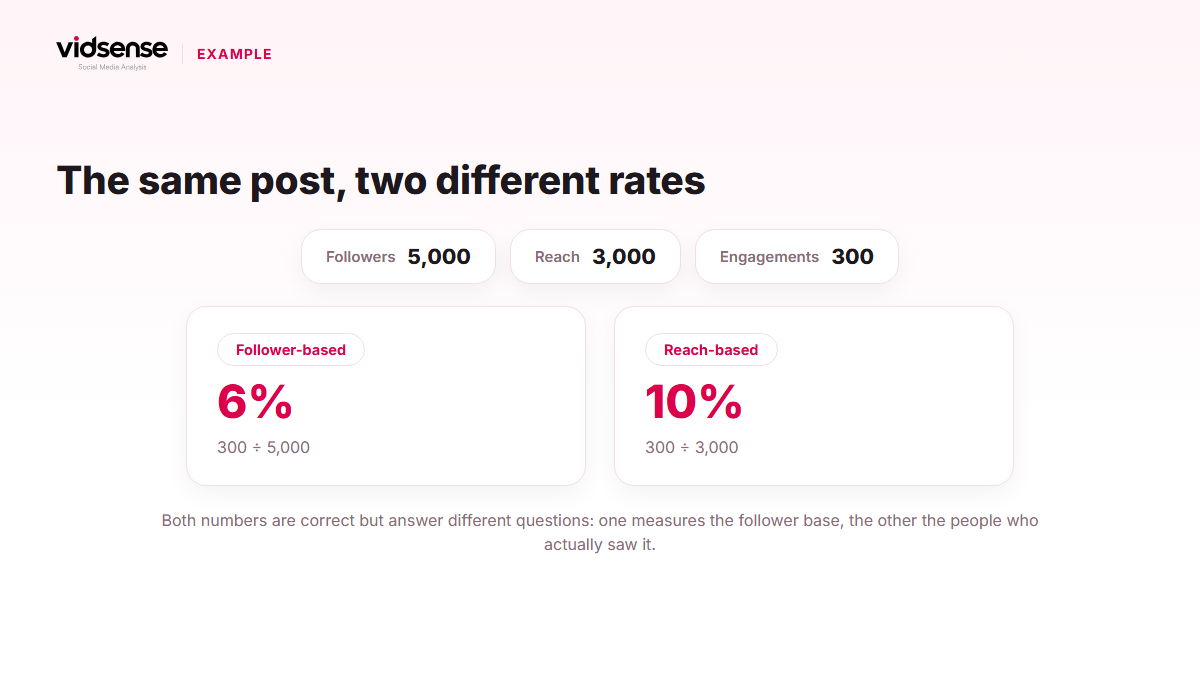
Say a post reaches 3,000 people on an account with 5,000 followers, and 300 people engage through a like, comment, save, or share. The follower-based formula gives 300/5,000 = 6%. The reach-based formula gives 300/3,000 = 10%. Both numbers are "correct," but they answer different questions: the first answers "how much of my follower base engaged," the second answers "how much of the people who actually saw it engaged." Tracking the reach-based rate over time lets you follow real engagement without it being distorted by the natural gap between follower growth and engagement.
If an account's follower count is rising quickly while its reach-based rate stays flat, that usually means new followers haven't turned into an active audience yet — in that case, the reach-based number gives a more realistic picture than the follower-based one.
Should I track this weekly or monthly? They answer different questions. A weekly view shows the short-term effect of something you just changed, like a new format or a new posting time. A monthly view filters out seasonal noise and shows a steadier trend. Using both together gives you fast feedback and a reliable big picture at the same time.
Understanding a dip in engagement rate often takes more than one number. VidSense lets you check content before you publish and see possible risk signals ahead of time. Create a free account to use the text check and, for videos or images, the content check.
Source: Instagram's own explanation of how ranking works — about.instagram.com.